Welcome
It’s a vast world out there. We’re going to cover a lot of ground. Don’t be scared. It’s going to be so. much. FUN!
I’m just playing right now and specifically thinking about code styling. So here’s a code chunk for producing a very basic plot.
# load the libraries
library(tidyverse)

# create a plot
ggplot(mpg, aes(displ, cty)) +
  geom_point() +
geom_smooth() 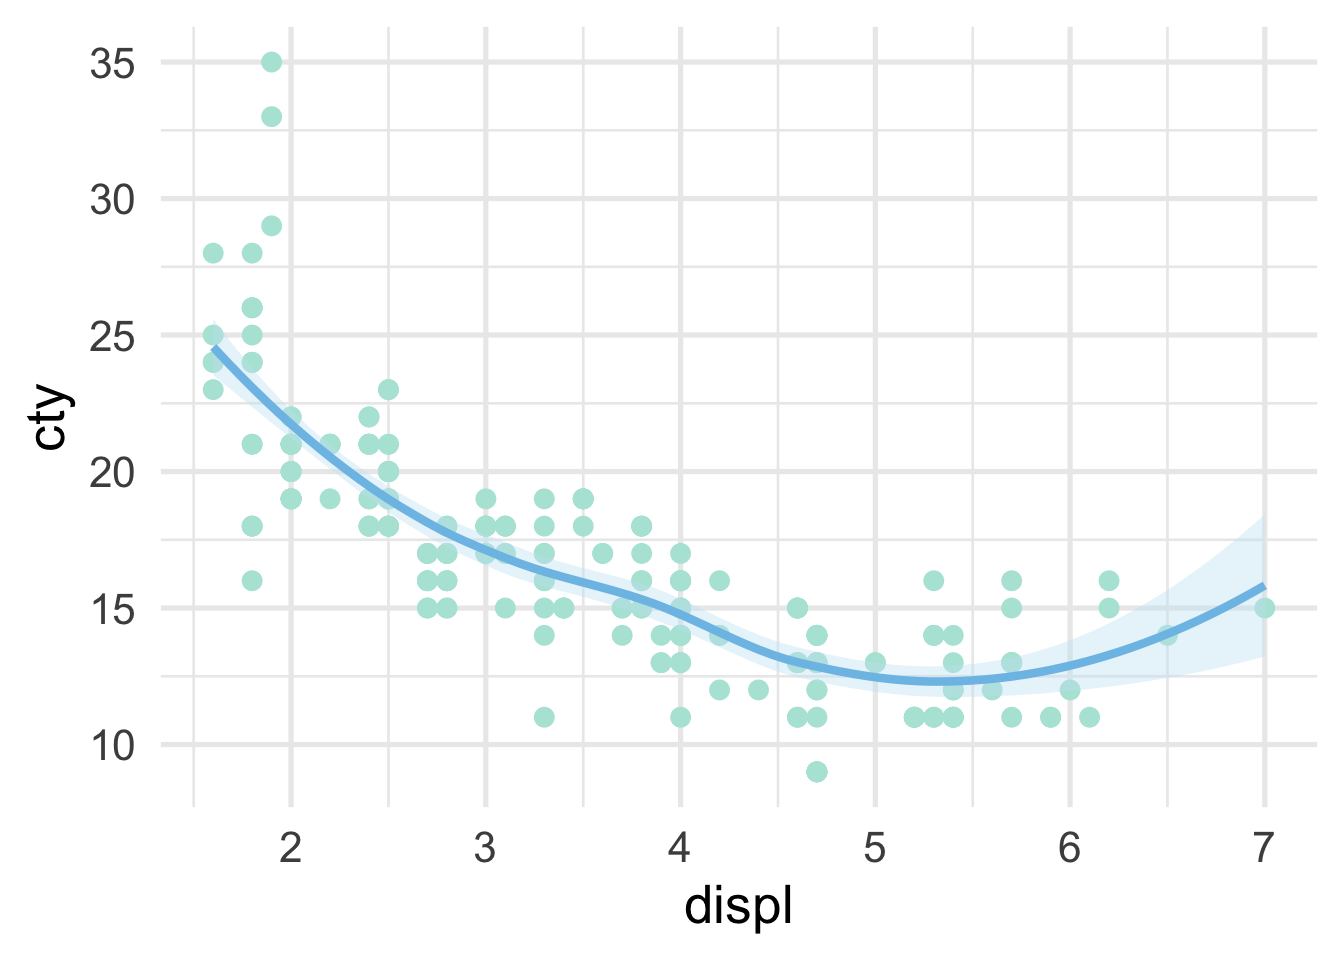
We could of course create some summary data too.
# create some summary data
mpg %>%
  group_by(cyl) %>%
  summarize(mean_cty = mean(cty),
            sd_cty = sd(cty))
## # A tibble: 4 x 3
## cyl mean_cty sd_cty
## <int> <dbl> <dbl>
## 1 4 21.0 3.50
## 2 5 20.5 0.577
## 3 6 16.2 1.77
## 4 8 12.6 1.81But the above doesn’t give us an example of a string, which we’ll also use a lot, so let’s try an example with that.
## # A tibble: 18 x 11
##    manufacturer model    displ  year   cyl trans   drv     cty   hwy fl    class
##    <chr>        <chr>    <dbl> <int> <int> <chr>   <chr> <int> <int> <chr> <chr>
##  1 audi         a4         1.8  1999     4 auto(l… f        18    29 p     comp…
##  2 audi         a4         1.8  1999     4 manual… f        21    29 p     comp…
##  3 audi         a4         2    2008     4 manual… f        20    31 p     comp…
##  4 audi         a4         2    2008     4 auto(a… f        21    30 p     comp…
##  5 audi         a4         2.8  1999     6 auto(l… f        16    26 p     comp…
##  6 audi         a4         2.8  1999     6 manual… f        18    26 p     comp…
##  7 audi         a4         3.1  2008     6 auto(a… f        18    27 p     comp…
##  8 audi         a4 quat…   1.8  1999     4 manual… 4        18    26 p     comp…
##  9 audi         a4 quat…   1.8  1999     4 auto(l… 4        16    25 p     comp…
## 10 audi         a4 quat…   2    2008     4 manual… 4        20    28 p     comp…
## 11 audi         a4 quat…   2    2008     4 auto(s… 4        19    27 p     comp…
## 12 audi         a4 quat…   2.8  1999     6 auto(l… 4        15    25 p     comp…
## 13 audi         a4 quat…   2.8  1999     6 manual… 4        17    25 p     comp…
## 14 audi         a4 quat…   3.1  2008     6 auto(s… 4        17    25 p     comp…
## 15 audi         a4 quat…   3.1  2008     6 manual… 4        15    25 p     comp…
## 16 audi         a6 quat…   2.8  1999     6 auto(l… 4        15    24 p     mids…
## 17 audi         a6 quat…   3.1  2008     6 auto(s… 4        17    25 p     mids…
## 18 audi         a6 quat…   4.2  2008     8 auto(s… 4        16    23 p     mids…
Finally, let’s write a quick function that has a logical in it (since we haven’t tested those yet).
## [1] 23.44017And overall, I’m pretty happy with how that’s all looking.
Here’s an example div tip. We can play around with fonts and colors.
The title of this divtip
Here’s another div tip. To use for important definitions?
This takes a long time